
Author Jennifer Morningstar

This is a case study about an incident I investigated involving a major upset in a distillation column. This blog builds on the previous blogs about the Distributed Control System, DCS – Data is the Key.
Distillation is a method of separating mixtures of compounds with differing boiling points. Uncle Bill with his still on the hill separates ethanol, that boils at 173°F, from water that boils at 212°F. If the mixture is heated to above 173°F, but below 212°F, the ethanol will boil, the vapor will travel up out of the unit and then can be condensed and served over ice with an olive… Any mixture of two or more chemicals with different boiling points can be separated in this way. The distillation column can have individual trays or be packed with inert material (ceramic or metal discs, saddles, etc.). The trays and/or packing facilitate the liquid and vapor phases contacting each other, improving separation. The larger the gap between boiling points, the easier the separation. The operating temperatures of a distillation column will, therefore, be determined by the compounds being separated. But the temperature profiles are always the same, hotter on the bottom, cooler on the top. There are far more intricacies in operating and understanding distillation, but these are the basics you need.
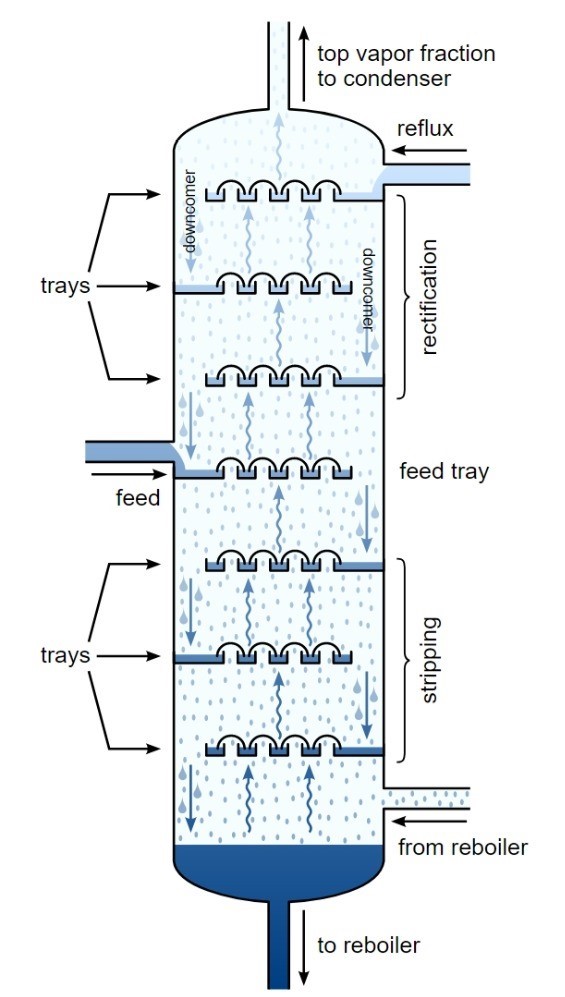
Cutaway view of a simple trayed distillation column
The subject distillation column was separating dimethyl terephthalate (DMT) from ortho-xylene and methanol. This specific make-up is important because DMT will solidify at temperatures less than 320°F while methanol boils at 148°F, so the top of this column was operating at a temperature that would freeze molten DMT. This was the incident; there was a pressure surge from the bottom of the column and molten DMT was forced up and out of the top of the column where it promptly froze in lines and pumps and heat exchangers, oh my! It was expensive to clean up and it was expensive to be shutdown while it was cleaned up.
I was put on the team to find out what happened…yay, me! The first thing we did was to look at trends built into PI (as in the Greek letter, π). PI was the name of the data historian we were using at that plant, there are others, as well. Data historian software simply records the reading of a process variable measured by the DCS. So, if the DCS is the lens that views the process, the data historian is the tape or chip upon which that data is stored for later review. Another feature of data historian software is that you can create groups of up to 4 points you look at often, called a trend. You just pull up the trend instead of having to build it from scratch each time.
In our setup, there were multiple trays where the temperature was monitored in this column, and multiple combinations of those temperatures on trends. One of the first trends that drew our attention was one showing that the temperature on one tray had been slowly increasing for some time right before this incident occurred. All the other trays were steady.
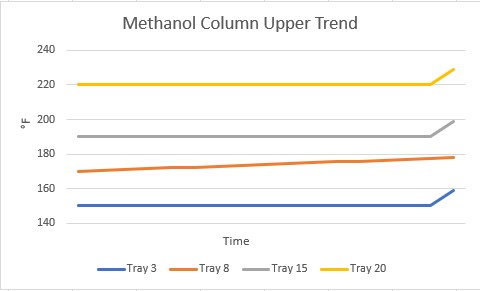
Example of PI trend
What was going on at that tray? It was right where the feed came into the column. Was there a problem with the feed? We chased dozens of rabbits down their holes for at least two days, trying to determine what was going on at that tray!! Finally, it was decided we needed to look at more than the pre-made trends in PI. We extracted a bunch of data into a format we could use in Excel to make our own graphs.
When we looked at the same tray temperatures made in Excel, a much different picture was presented!
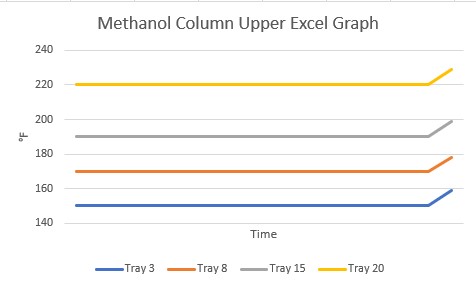
Example of Excel graph
This is when I learned about refresh rate. The refresh rate is the frequency with which PI will update a value of a process variable: every 0.5 seconds, 1.0 seconds, 10 seconds. It is user-defined for each point. For whatever reason, the refresh rate for Tray 8 was much longer than for the other trays. The PI software simply drew a straight line between the two points for display on the trend. That cleared up the mystery of the descending tray temperature and we went on to investigate the incident.
Needless to say, afterwards, we combed through every point in PI to verify the refresh rate. You might think we make them all the smallest value possible, to have the most data possible. Had money been no object and we could store data to our engineer’s heart’s content we would have! Instead, we let things that don’t change quickly (levels in tanks) have longer rates and things like temperatures have shorter rates.
Now, whenever I’m investigating an incident, I always ask for the data to be extracted from the data historian instead of relying on trends given to me! (and I always ask Uncle Bill for an extra olive, too…)
Senior Consulting Engineer of The Warren Group. A licensed professional engineer in several states and a NAFI Certified Fire and Explosion Investigator, she holds a Bachelor of Science Degree in Chemical Engineering from Virginia Polytechnic Institute and State University, as well as a Master of Business Administration from the University of South Carolina. Over her 20-year engineering career, Jennifer has conducted forensic investigations involving chemical release/exposure, OSHA process safety management, industrial accident investigation, equipment failures, fires & explosions, and scope of damage/cost to repair. Jennifer is a member of the National Association of Fire Investigators (NAFI), the South Carolina chapter of the International Association of Arson Investigators (SCIAAI), and the American Institute of Chemical Engineers (AIChE).
